U.S. Markets
After sliding for much of last month on rising yields, credit rating downgrades, and economic weakness out of China, stocks staged a late-August rally to help trim losses.
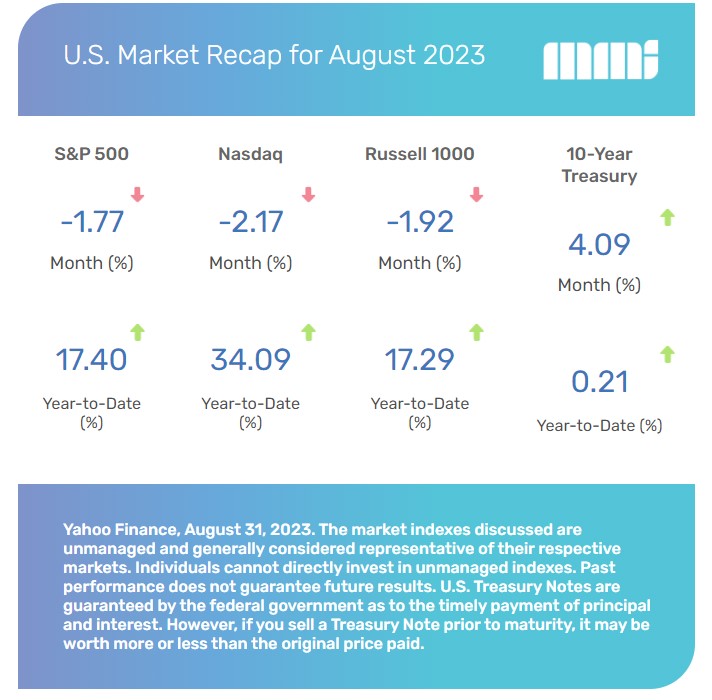
The Dow Jones Industrial Average lost 2.36 percent, while the Standard & Poor’s 500 Index dropped 1.77 percent. The Nasdaq Composite fell 2.17 percent. [1]
Another Weak August
In recent years, August has had a reputation as a weak month for stocks. Since 1986, August stock market performance has ranked as the lowest of all 12 months, returning on average a negative 0.8 percent. [2]
The August 2023 weakness mirrored historical experience, so the declines seen the past month did not surprise many market analysts, especially given that the market was perhaps due for some consolidation following the strong performance through the first seven months of the year.
August Headwinds
The stock market battled a number of headwinds. Rising bond yields pressured stocks throughout the month, while investors were surprised by a downgrade of U.S. government debt at the start of the month and a credit downgrade of several banks toward the end of the month.
Economic news out of China also proved to be unsettling. Falling exports and fresh troubles in their already stressed property market indicated that China was having more difficulty escaping its economic doldrums—an unfavorable development for global growth.
Earnings Upbeat
The second earnings season came to a conclusion in August with better-than-expected results. As of August 25th, with 485 of the companies in the S&P 500 reporting, 79 percent posted earnings above market estimates. Earnings growth rates were highly dispersed, with the Consumer Discretionary sector showing solid results and the Energy sector reporting softer numbers. [3]
Toward the month’s end, stocks rallied on “a proceed carefully” rate hike message from Fed Chair Powell at Jackson Hole and weak economic data, which triggered a retreat in bond yields that helped push stocks higher.
Sector Scorecard
The only industry sector posting a gain was Energy, which rose 3.73 percent. The remaining industry sectors ended lower last month, with losses in Communications Services (-2.46 percent), Consumer Discretionary (-2.34 percent), Consumer Staples (-4.77 percent), Financials (-1.81 percent), Health Care (-0.43 percent), Industrials (-1.47 percent), Materials (-2.22 percent), Real Estate (-3.12 percent), Technology (-1.21 percent), and Utilities (-6.61 percent). [4]
What Investors May Be Talking About in September
All eyes are expected to shift to the Fed’s two-day meeting, which concludes on September 20. Since the Fed’s July 2023 meeting, when the federal funds rate was hiked by a quarter percentage point, inflation reports have shown moderate price increases, perhaps supporting the case for holding off on a rate hike. [5]
However, economic growth appears to be accelerating. Second-quarter gross domestic product grew at an annualized rate of 2.1 percent, which was a bit faster than the first quarter’s expansion rate of 2.0 percent. [6]
Q3 Gross Domestic Product (GDP) in Focus
However, third-quarter economic growth may be higher still. According to the Federal Reserve Bank of Atlanta’s GDPNow model, which attempts to estimate current-quarter GDP growth, the economy is forecasted to grow at an annualized rate of 5.0 percent in Q3. [6]
Although the markets believe that the rate hike cycle is nearing an end, what the FOMC decides on rates this month, and perhaps more importantly, what it signals about what it may do next, may set the tone for the financial market into the final quarter of the year.
World Markets
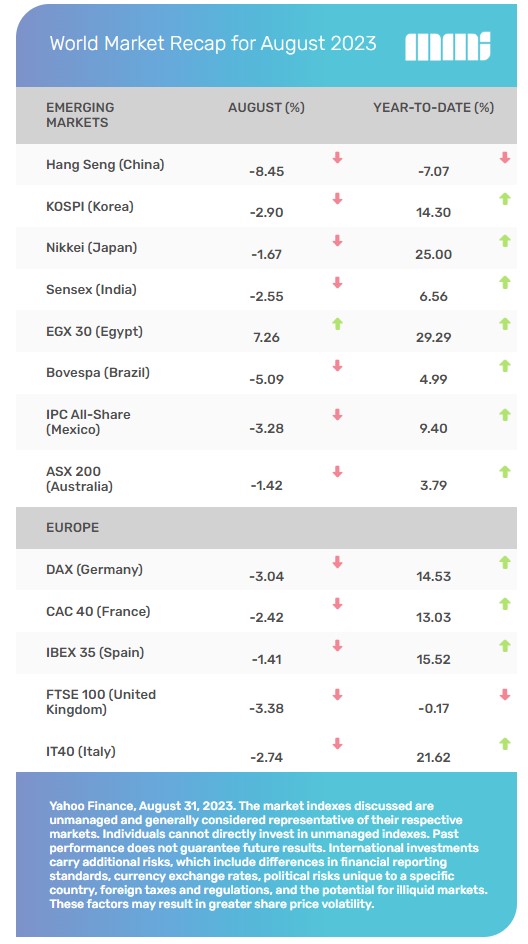
August weakness was more pronounced in overseas markets as investors grappled with persistent inflation in Europe, the prospect of another rate hike by the European Central Bank, and deepening economic woes in China.
For August, the MSCI-EAFE Index fell 4.10 percent. [7]
European markets were nearly uniformly lower, with losses in France (-2.42 percent), Germany (-3.04 percent), Italy (-2.74 percent), Spain (-1.41 percent), and the U.K. (-3.38 percent). [8V
Some Pacific Rim markets were even weaker. Hong Kong lost 8.45 percent, Australia 1.42 percent, and Japan 1.67 percent. [9]
Indicators
Gross Domestic Product (GDP)
GDP growth in the second quarter was revised downward, from its initial annualized growth estimate of 2.4 percent to 2.1 percent. [10]
Employment
Hiring moderated in July as nonfarm payrolls increased by 187,000. The increase was below the average monthly jump in the first six months. The unemployment rate fell from 3.6 percent to 3.5 percent, while average hourly earnings increased 4.4 percent from a year ago. [11]
Retail Sales
Retail sales picked up 0.7 percent in July, exceeding the consensus estimate of 0.4 percent. Excluding auto sales, spending was up 1.0 percent. These were the best gains since January. [12]
Industrial Production
Industrial production rose one percent in July, driven by a spike in utilities use due to hot weather and an increase in automobile production. [13]
Housing
Housing starts increased 3.9 percent in July. Permits to build were up slightly (+0.1 percent). [14]
Existing home sales fell 2.2 percent in July from the prior month and 16.6 percent from a year ago. Low inventory continues to be an overhang, while the number of homes available for purchase remains roughly half that of pre-COVID numbers. [15]
New home sales increased by 4.4 percent as a shortage of existing homes drove buyers to new construction. Sales were up by 31.5 percent from last July levels. [16]
Consumer Price Index (CPI)
Consumer prices rose at an annual rate of 3.2 percent in July, coming in slightly below consensus forecasts and somewhat higher than June’s 3.0 percent annual rise. July’s CPI and Core CPI (excludes food and energy) monthly increase was 0.2 percent, in line with expectations. [17]
Durable Goods Orders
Durable goods orders fell 5.2 percent in July after four straight months of increases. It was the steepest decline since April 2020. [18]
The Fed
The minutes from the July meeting of the Federal Open Market Committee showed that most members voiced some risks in raising interest rates beyond the quarter-point increase they agreed to implement.
Also acknowledged was the risk that inflation would not come down sufficiently and may require additional rate increases. [19]
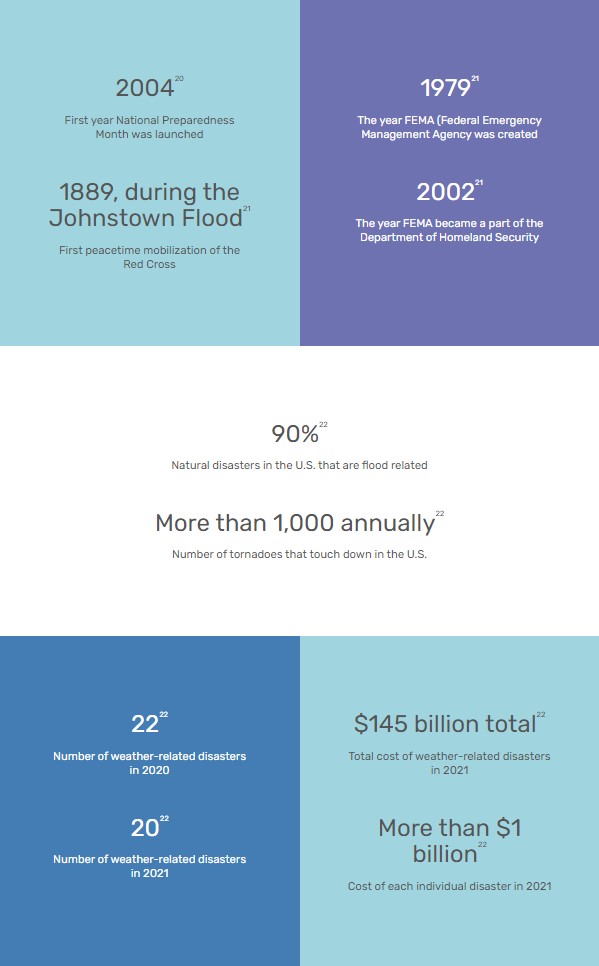
By the Numbers: National Preparedness Month
Lighthouse Financial, LLC may be reached at www.lighthousefinancialllc.com, 303-444-1818 or wisdom@lighthousefinancialllc.com.
Investment and Advisory services are provided by Petra Financial Advisors, Inc., headquartered at 2 N. Nevada Ave. Suite 1300, Colorado Springs, CO 80903.
The content is developed from sources believed to be providing accurate information. The information in this material is not intended as tax or legal advice. Please consult legal or tax professionals for specific information regarding your individual situation. This material was developed and produced by FMG Suite to provide information on a topic that may be of interest. FMG Suite, LLC, is not affiliated with the named representative, broker-dealer, or state- or SEC-registered investment advisory firm. The opinions expressed and material provided are for general information and should not be considered a solicitation for the purchase or sale of any security.
Investing involves risks, and investment decisions should be based on your own goals, time horizon and tolerance for risk. The return and principal value of investments will fluctuate as market conditions change. When sold, investments may be worth more or less than their original cost.
Any companies mentioned are for illustrative purposes only. It should not be considered a solicitation for the purchase or sale of the securities. Any investment should be consistent with your objectives, timeframe, and risk tolerance.
The forecasts or forward-looking statements are based on assumptions, subject to revision without notice, and may not materialize.
The market indexes discussed are unmanaged and generally considered representative of their respective markets. Individuals cannot directly invest in unmanaged indexes. Past performance does not guarantee future results.
The Dow Jones Industrial Average is an unmanaged index that is generally considered representative of large-capitalization companies on the U.S. stock market. The S&P 500 Composite Index is an unmanaged group of securities considered to be representative of the stock market in general. The Nasdaq Composite is an index of the common stocks and similar securities listed on the Nasdaq stock market and considered a broad indicator of the performance of stocks of technology and growth companies. The Russell 1000 Index is an index that measures the performance of the highest-ranking 1,000 stocks in the Russell 3000 Index, which is comprised of 3,000 of the largest U.S. stocks. The MSCI EAFE Index was created by Morgan Stanley Capital International (MSCI) and serves as a benchmark for the performance in major international equity markets, as represented by 21 major MSCI indexes from Europe, Australia, and Southeast Asia. Index performance is not indicative of the past performance of a particular investment. Past performance does not guarantee future results. Individuals cannot invest directly in an index. The return and principal value of stock prices will fluctuate as market conditions change. And shares, when sold, may be worth more or less than their original cost.
International investments carry additional risks, which include differences in financial reporting standards, currency exchange rates, political risks unique to a specific country, foreign taxes and regulations, and the potential for illiquid markets. These factors may result in greater share price volatility.
The Hang Seng Index is a benchmark index for the blue-chip stocks traded on the Hong Kong Stock Exchange. The KOSPI is an index of all stocks traded on the Korean Stock Exchange. The Nikkei 225 is a stock market index for the Tokyo Stock Exchange. The SENSEX is a stock market index of 30 companies listed on the Bombay Stock Exchange. The Jakarta Composite Index is an index of all stocks that are traded on the Indonesia Stock Exchange. The Bovespa Index tracks 50 stocks traded on the Sao Paulo Stock, Mercantile, & Futures Exchange. The IPC Index measures the companies listed on the Mexican Stock Exchange. The MERVAL tracks the performance of large companies based in Argentina. The ASX 200 Index is an index of stocks listed on the Australian Securities Exchange. The DAX is a market index consisting of the 30 German companies trading on the Frankfurt Stock Exchange. The CAC 40 is a benchmark for the 40 most significant companies on the French Stock Market Exchange. The Dow Jones Russia Index measures the performance of leading Russian Global Depositary Receipts (GDRs) that trade on the London Stock Exchange. The FTSE 100 Index is an index of the 100 companies with the highest market capitalization listed on the London Stock Exchange.
Please consult your financial professional for additional information.
Copyright 2023 FMG Suite.
- WSJ.com, August 31, 2023
- MarketWatch.com, July 29, 2023
- LipperAlpha.refinitive.com, August 25, 2023
- SectorSPDR.com, August 31, 2023
- FederalReserve.gov, 2023
- AtlantaFed.org, 2023
- MSCI.com, August 31, 2023
- MSCI.com, August 31, 2023
- MSCI.com, August 31, 2023
- CNBC.com, August 30, 2023
- WSJ.com, August 4, 2023
- CNBC.com, August 15, 2023
- MarketWatch.com, August 16, 2023
- CNBC.com, August 22, 2023
- Finance.Yahoo.com, August 23, 2023
- CNN.com, August 23, 2023
- CNBC.com, August 10, 2023
- Morningstar.com, August 24, 2023
- WSJ.com, August 16, 2023
- Weather.gov, March 2023
- NationalToday.com, March 2023
- Bankrate.com, May 27, 2022