U.S. Markets
Stocks notched solid gains in the first quarter as enthusiasm about artificial intelligence, signs of a soft landing, and dovish talk from the Fed buoyed investor confidence.
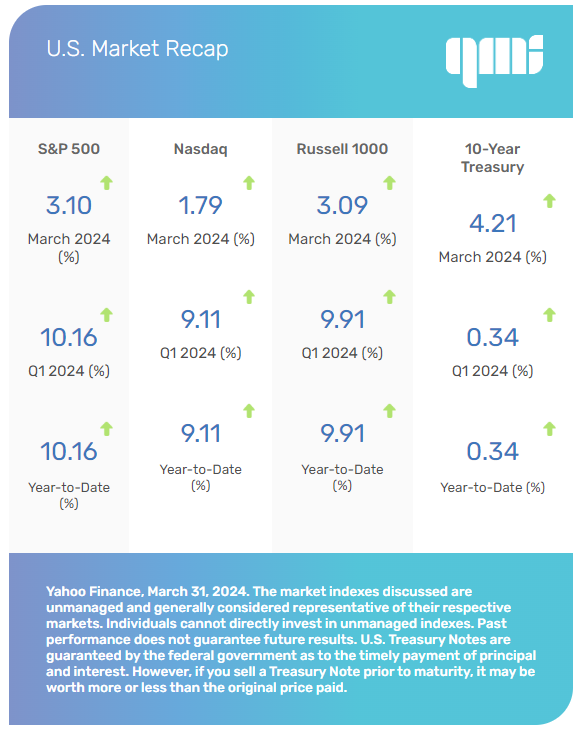
For the quarter, the Dow Jones Industrial Average rose 5.62 percent, the Standard & Poor’s 500 Index gained 10.16 percent, and the Nasdaq Composite picked up 9.11 percent. [1]
Rocky Start in Q1
Stocks saw modest gains in January as positive economic data (retail sales, gross domestic product [GDP] report) and upbeat Q4 corporate reports helped offset a mixed inflation update. As expected, the Fed kept rates unchanged at its January meeting. The more neutral language used by the Fed led some to believe the Fed was concerned about inflation and might be slow to adjust rates. That news took the wind out of stocks’ sails, curtailing gains for the month. [2]
Building Momentum
In February, stocks regained some momentum as investor enthusiasm surrounding artificial intelligence overshadowed the Fed’s next move with interest rates. By mid-month, investors’ attention shifted to any company offering an artificial intelligence update in its quarterly report.
Marching Onward
Mostly positive economic news in March—including strong but moderating GDP growth, steady unemployment, and decelerating inflation—propelled stocks. All three averages set record highs during the month. [3]
At its March meeting, the Fed left rates unchanged and signaled its inclination to cut interest rates three times this year—each time by a quarter of a percentage point. Markets rallied to new highs following the news, which led to the S&P having its best first-quarter performance in five years. [4]
Sector Scorecard
The Q1 rally was generally broad-based, with all but one major sector of the S&P 500 Index posting gains for the quarter. Energy (+12.57 percent) topped the pack of double-digit leaders that included the tech-heavy Communications Services sector (+12.37 percent), Financials (+12.02 percent), and Industrials (+10.50 percent)—all of which outperformed the overall index.
Materials (+8.59 percent), Health Care (+8.32 percent), Technology (+8.20 percent), Consumer Staples (+6.01 percent), Consumer Discretionary (+2.56 percent), and Utilities (+3.66 percent) also notched solid positive returns, further demonstrating how market leadership broadened beyond tech-related names over the quarter. Real Estate (-1.32 percent) was the sole sector to finish in the red. [5]
What Investors May Be Talking About in April
The Fed opens its two-day meeting on April 30, and investors can expect the Fed to look closely at the drivers of inflation. The Fed will examine each component of the Consumer Price Index, which measures the prices of consumer goods and services across more than 200 categories. [6]
In January, more than two-thirds of the CPI’s 3.1 percent was driven by the category called shelter, which includes rent prices. Shelter was sticky again in February and has been one of the most stubborn areas for some time. [7]
The Fed will be watching shelter and other key categories to see what’s driving inflation as it evaluates whether to adjust short-term rates at some point this year.
World Markets
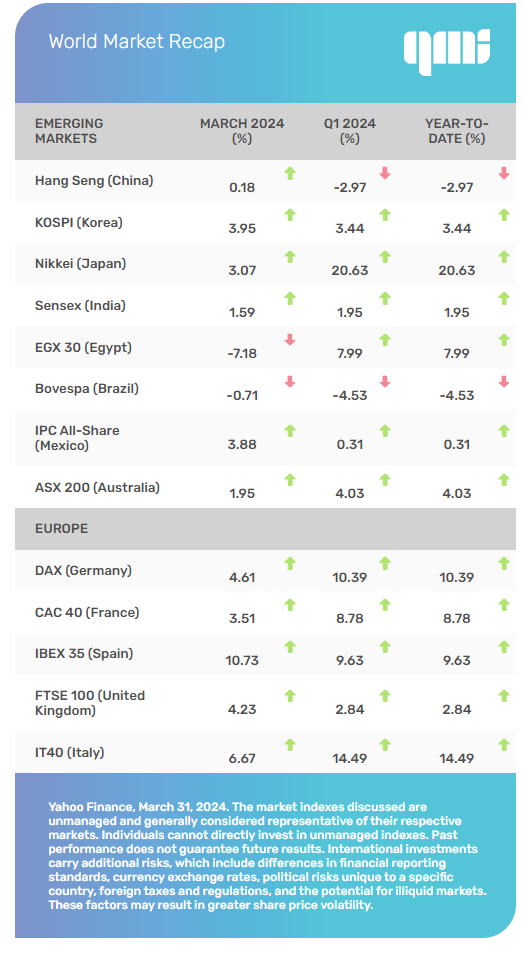
The MSCI EAFE Index rose 5.06 percent during the first quarter on signs that the European Central Bank and others were considering cutting short-term rates. In fact, Switzerland’s Swiss National Bank cut its main policy rate in late March. [8]
In Europe, Spain (+9.63 percent), Italy (+14.49 percent), Germany (+10.39 percent), the United Kingdom (+2.83 percent), and France (+8.78 percent) all posted gains for the quarter. [9]
Pacific Rim markets also trended higher, with Japan (+20.63 percent) and Korea (+3.44 percent) leading. [10]
Indicators
Gross Domestic Product (GDP)
Led by consumer and government spending, the U.S. economy grew at a 3.4 percent annualized rate in the fourth quarter, revised up from the initial estimate. The GDP was higher than expectations but slower than the 4.9 percent expansion in the third quarter. [11]
Employment
Employers created 275,000 jobs in February, besting expectations. The unemployment rate increased to 3.9 percent while average hourly earnings increased slightly less than expected. [12]
Retail Sales
Retail sales rose 0.6 percent in February, just short of expectations. [13]
Industrial Production
Industrial output edged up 0.1 percent in February following a 0.5 percent drop in January, as manufacturing appeared to recover from unseasonably cold winter weather. [14]
Housing
Single-family housing starts rebounded in February thanks to milder weather, climbing 11.6 percent. That compared with a drop in January. [15]
Sales of existing homes increased 9.5 percent in February to a seasonally adjusted annualized rate of 4.38 million units, the largest monthly gain in a year. Higher demand boosted the median sales price by 5.7 percent to $384,500, the eighth straight month of year-over-year increases. [16]
New home sales in February slipped 0.3 percent over the prior month but increased by 5.9 percent over February last year. [17]
Consumer Price Index (CPI)
Consumer prices rose 0.4 percent in February and were up 3.2 percent from a year ago—a bit hotter than economists expected but cooler than investors feared. Energy and shelter accounted for more than 60 percent of February’s gain, while two-thirds of January’s gain came from shelter. [18]
Durable Goods Orders
Orders of manufactured goods designed to last three years or longer rebounded 1.4 percent in February, beating expectations. [19]
The Fed
The Fed left rates unchanged in the first quarter. After its January 31 meeting, the Federal Open Market Committee used more neutral language in its policy document and indicated a subtle shift from considering rate cuts to proposing they could be possible unless inflation became a concern. However, they cautioned that cuts weren’t automatic and would only consider them if inflation dangers had abated. [20]
At the March meeting, the Committee also left rates unchanged but signaled its inclination to cut interest rates three times this year. That was a positive surprise for some investors who worried about the Fed’s commitment to adjusting rates. [21]
By the Numbers: Women’s Sports Records
Lighthouse Financial, LLC may be reached at www.lighthousefinancialllc.com, 303-444-1818 or wisdom@lighthousefinancialllc.com.
Investment and Advisory services are provided by Petra Financial Advisors, Inc., headquartered at 2 N. Nevada Ave. Suite 1300, Colorado Springs, CO 80903.
The content is developed from sources believed to be providing accurate information. The information in this material is not intended as tax or legal advice. Please consult legal or tax professionals for specific information regarding your individual situation. This material was developed and produced by FMG Suite to provide information on a topic that may be of interest. FMG Suite, LLC, is not affiliated with the named representative, broker-dealer, or state- or SEC-registered investment advisory firm. The opinions expressed and material provided are for general information and should not be considered a solicitation for the purchase or sale of any security.
Investing involves risks, and investment decisions should be based on your own goals, time horizon and tolerance for risk. The return and principal value of investments will fluctuate as market conditions change. When sold, investments may be worth more or less than their original cost.
Any companies mentioned are for illustrative purposes only. It should not be considered a solicitation for the purchase or sale of the securities. Any investment should be consistent with your objectives, timeframe, and risk tolerance.
The forecasts or forward-looking statements are based on assumptions, subject to revision without notice, and may not materialize.
The market indexes discussed are unmanaged and generally considered representative of their respective markets. Individuals cannot directly invest in unmanaged indexes. Past performance does not guarantee future results.
The Dow Jones Industrial Average is an unmanaged index that is generally considered representative of large-capitalization companies on the U.S. stock market. The S&P 500 Composite Index is an unmanaged group of securities considered to be representative of the stock market in general. The Nasdaq Composite is an index of the common stocks and similar securities listed on the Nasdaq stock market and considered a broad indicator of the performance of stocks of technology and growth companies. The Russell 1000 Index is an index that measures the performance of the highest-ranking 1,000 stocks in the Russell 3000 Index, which is comprised of 3,000 of the largest U.S. stocks. The MSCI EAFE Index was created by Morgan Stanley Capital International (MSCI) and serves as a benchmark for the performance in major international equity markets, as represented by 21 major MSCI indexes from Europe, Australia, and Southeast Asia. Index performance is not indicative of the past performance of a particular investment. Past performance does not guarantee future results. Individuals cannot invest directly in an index. The return and principal value of stock prices will fluctuate as market conditions change. And shares, when sold, may be worth more or less than their original cost.
International investments carry additional risks, which include differences in financial reporting standards, currency exchange rates, political risks unique to a specific country, foreign taxes and regulations, and the potential for illiquid markets. These factors may result in greater share price volatility.
The Hang Seng Index is a benchmark index for the blue-chip stocks traded on the Hong Kong Stock Exchange. The KOSPI is an index of all stocks traded on the Korean Stock Exchange. The Nikkei 225 is a stock market index for the Tokyo Stock Exchange. The SENSEX is a stock market index of 30 companies listed on the Bombay Stock Exchange. The Jakarta Composite Index is an index of all stocks that are traded on the Indonesia Stock Exchange. The Bovespa Index tracks 50 stocks traded on the Sao Paulo Stock, Mercantile, & Futures Exchange. The IPC Index measures the companies listed on the Mexican Stock Exchange. The MERVAL tracks the performance of large companies based in Argentina. The ASX 200 Index is an index of stocks listed on the Australian Securities Exchange. The DAX is a market index consisting of the 30 German companies trading on the Frankfurt Stock Exchange. The CAC 40 is a benchmark for the 40 most significant companies on the French Stock Market Exchange. The Dow Jones Russia Index measures the performance of leading Russian Global Depositary Receipts (GDRs) that trade on the London Stock Exchange. The FTSE 100 Index is an index of the 100 companies with the highest market capitalization listed on the London Stock Exchange.
Please consult your financial professional for additional information.
Copyright 2024 FMG Suite.
- WSJ.com, March 31, 2024
- WSJ.com, January 31, 2024
- CNBC.com, March 28, 2024
- CNBC.com, March 28, 2024
- SectorSPDR.com, March 28, 2024
- BureauofLaborStatistics.gov, 2024
- CNBC.com, February 13, 2024
- MSCI.com, March 31, 2024
- MSCI.com, March 31, 2024
- MSCI.com, March 31, 2024
- CNBC.com, January 25, 2024
- BureauofEconomicAnalysis.gov, March 28, 2024
- CNBC.com, March 8, 2024
- FederalReserve.gov, March 15, 2024
- Reuters.com, March 19, 2024
- CNBC.com, March 21, 2024
- CNBC.com, March 25, 2024
- CNBC.com, March 12, 2024
- Reuters.com, March 26, 2024
- WSJ.com, January 31, 2024
- WSJ.com, March 20, 2024
- NYtimes.com, December 8, 2023
- Womentalksports.com, December 27, 2023
- Womentalksports.com, December 27, 2023
- Olympics.com December 3, 2023
- Olympics.com December 3, 2023