U.S. Markets
Stocks lost a portion of their first-half gains in the third quarter as a continued tight monetary bias from the Federal Reserve sent bond yields higher, unsettling stock investors throughout August and September.
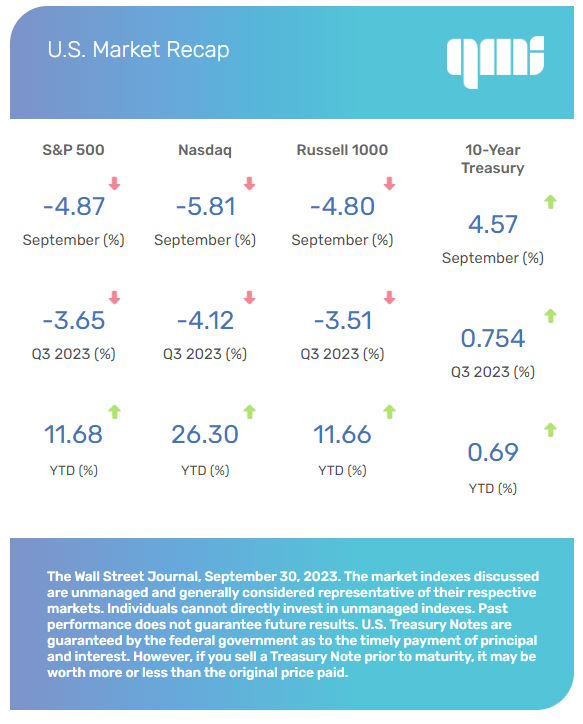
For the three months ending September 30, the Dow Jones Industrial Average declined 2.62 percent, while the Standard & Poor’s 500 Index lost 3.65 percent. The Nasdaq Composite fell 4.12 percent. [1]
A July Rally Faded
The strong price momentum during the first half of the year continued into the start of the third quarter as stocks rose in July. Cooling inflation, a better-than-anticipated kick-off to second-quarter earnings reports, and a growing belief that the U.S. economy may avoid falling into a recession helped fuel the gains.
However, in August, sentiment turned. Multiple headwinds—including rising bond yields, credit rating downgrades (both U.S. government debt and corporate debt), and continued economic weakness in China—dampened enthusiasm. A late-month rally trimmed losses, although it wasn’t enough to keep August from ending in the red.
Headwinds in August
August’s stock slide continued into September. An early-month rally faded, beginning with the start of a labor strike at the major automakers and a drop in consumer confidence. Rising oil prices further darkened investor mood as it fueled fears that the Fed might need to raise rates again to combat inflation caused by higher energy prices.
Earnings Outlook Brightens
The second-quarter earnings season, which largely ended in August, helped support stocks with better-than-expected results. As of August 25th, with 485 of the companies in the S&P 500 reporting, 79 percent posted earnings above market estimates. [2]
Perhaps more importantly, Wall Street’s outlook for third-quarter earnings improved during the quarter. Consensus analysts’ forecasts are estimating a 0.2 percent growth in earnings for the S&P 500 companies. Although this forecast appears slightly underwhelming, it would mark the first quarter of year-over-year earnings growth since the third quarter of 2022. [3]
Q3 Sector Scorecard
Most industry sectors experienced declines in the third quarter, including Consumer Discretionary (-5.20 percent), Consumer Staples (-7.23 percent), Health Care (-3.01 percent), Industrials (-5.53 percent), Materials (-5.21 percent), Real Estate (-9.60 percent), Technology (-5.71 percent), Financials (-1.60 percent), and Utilities (-9.95 percent). Both Communications Services (+0.75 percent) and Energy (+11.36 percent) rose over the last three months. [4]
What Investors May Be Talking About in October
The Fed elected to keep interest rates unchanged following the September meeting of the Federal Open Market Committee (FOMC), despite some hotter-than-expected inflation data. The Fed has not signaled what it may do with regards to rates at its upcoming two-day meeting, ending on November 1st, indicating that its decision will be data dependent. [5]
With the government shutdown averted in late September, the Fed will have current data when the FOMC meets.
Expect investors to be especially sensitive to September inflation data, which is scheduled to be released in mid-October. Should consumer prices and producer prices be higher than anticipated, the prospect of a rate hike may potentially jump.
However, if the report data comes in lower than expected it may take some pressure off the Fed.
World Markets
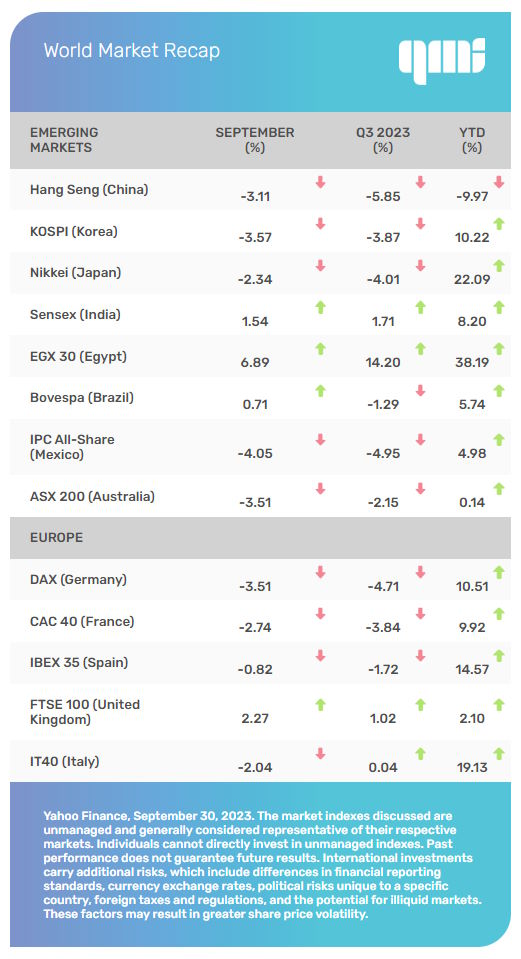
For Q3 2023, the MSCI-EAFE Index fell 4.71 percent. [6]
European markets were mixed, with quarterly losses in France (-3.84 percent), Germany (-4.71 percent), and Spain (-1.72 percent). The U.K. tacked on 1.02 percent and Italy was flat (+0.04%). [7]
Pacific Rim markets were down for the quarter, with China’s Hang Seng falling 5.85 percent and Japan’s Nikkei dropping 4.01 percent. [8]
Employment
Nonfarm payrolls grew by 187,000 in August, while the payroll estimates of June and July were revised downward by 110,000. Over the last three months, job gains have averaged 150,000, which is down substantially from its 238,000 monthly average gain for March through May. [10]
Retail Sales
Retail sales rose 0.6 percent in August, although much of the gain was due to higher gasoline prices. When excluding auto and gas sales, retail sales rose just 0.2 percent, which was above the 0.1 percent consensus forecast. [11]
Industrial Production
Industrial output at the nation’s factories, mines, and utilities rose 0.4 percent in August, exceeding expectations of a 0.2 percent gain. [12]
Housing
Housing starts skidded 11.3 percent, touching levels not seen since the pandemic. The steep decline was the result of a large drop in new construction of multifamily homes. [13]
Existing home sales fell 0.7 percent as higher mortgage rates and low inventory continued to weigh on the markets. Sales were down by 15.3 percent from last August. [14]
New home sales slid 8.7 percent in August, although they were higher by 5.8 percent from a year ago. [15]
Consumer Price Index (CPI)
A jump in gasoline prices pushed August inflation higher, with consumer prices increasing 0.6 percent month-over-month. For the last 12 months, prices have risen 3.7 percent versus the 3.2 percent annual increase in July. But core inflation, which excludes food and energy, eased from its 4.7 percent increase in July to a 4.3 percent rise in August. [16]
Durable Goods Orders
Orders of goods designed to last three years or longer rose 0.2 percent in August, beating economists’ expectations of a decline of 0.5 percent. Durable goods orders have risen during five of the last six months. [17]
The Fed
After raising interest rates by a quarter of a percentage point in July, the FOMC elected to keep interest rates unchanged following their September 19–20 meeting. They did, however, signal that another rate hike was likely before the end of the year.
In his post-announcement press conference, Fed Chair Jerome Powell emphasized that the inflation battle was not finished and future rate hike decisions would be based on the economic data. [18]
With the government shutdown averted in late September, the Fed will have current data when the FOMC meets Oct. 31–Nov. 1.
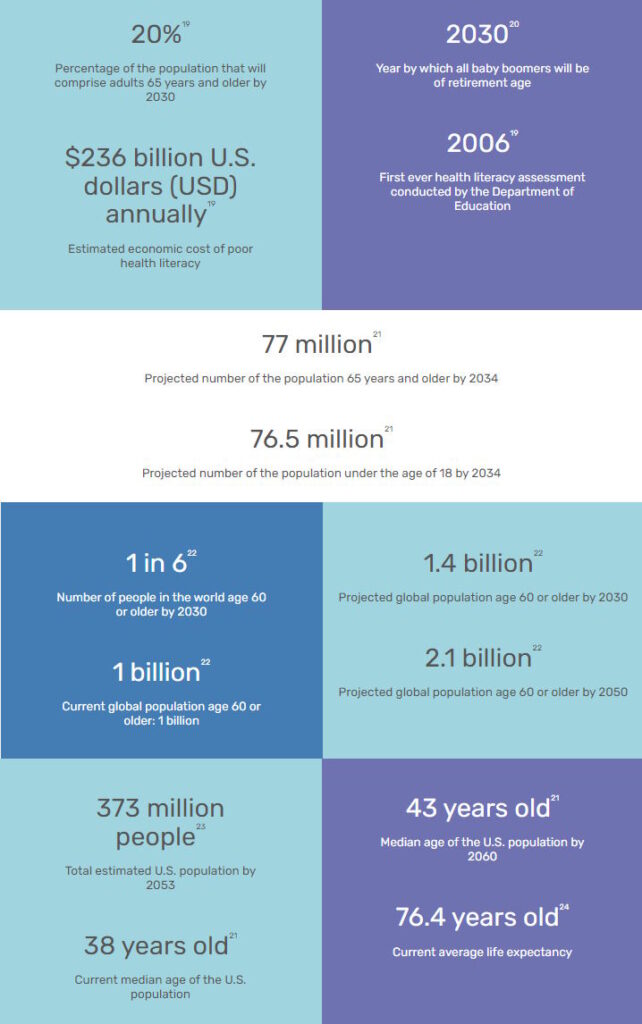
By the Numbers: Health Literacy Month
Lighthouse Financial, LLC may be reached at www.lighthousefinancialllc.com, 303-444-1818 or wisdom@lighthousefinancialllc.com.
Investment and Advisory services are provided by Petra Financial Advisors, Inc., headquartered at 2 N. Nevada Ave. Suite 1300, Colorado Springs, CO 80903.
The content is developed from sources believed to be providing accurate information. The information in this material is not intended as tax or legal advice. Please consult legal or tax professionals for specific information regarding your individual situation. This material was developed and produced by FMG Suite to provide information on a topic that may be of interest. FMG Suite, LLC, is not affiliated with the named representative, broker-dealer, or state- or SEC-registered investment advisory firm. The opinions expressed and material provided are for general information and should not be considered a solicitation for the purchase or sale of any security.
Investing involves risks, and investment decisions should be based on your own goals, time horizon and tolerance for risk. The return and principal value of investments will fluctuate as market conditions change. When sold, investments may be worth more or less than their original cost.
Any companies mentioned are for illustrative purposes only. It should not be considered a solicitation for the purchase or sale of the securities. Any investment should be consistent with your objectives, timeframe, and risk tolerance.
The forecasts or forward-looking statements are based on assumptions, subject to revision without notice, and may not materialize.
The market indexes discussed are unmanaged and generally considered representative of their respective markets. Individuals cannot directly invest in unmanaged indexes. Past performance does not guarantee future results.
The Dow Jones Industrial Average is an unmanaged index that is generally considered representative of large-capitalization companies on the U.S. stock market. The S&P 500 Composite Index is an unmanaged group of securities considered to be representative of the stock market in general. The Nasdaq Composite is an index of the common stocks and similar securities listed on the Nasdaq stock market and considered a broad indicator of the performance of stocks of technology and growth companies. The Russell 1000 Index is an index that measures the performance of the highest-ranking 1,000 stocks in the Russell 3000 Index, which is comprised of 3,000 of the largest U.S. stocks. The MSCI EAFE Index was created by Morgan Stanley Capital International (MSCI) and serves as a benchmark for the performance in major international equity markets, as represented by 21 major MSCI indexes from Europe, Australia, and Southeast Asia. Index performance is not indicative of the past performance of a particular investment. Past performance does not guarantee future results. Individuals cannot invest directly in an index. The return and principal value of stock prices will fluctuate as market conditions change. And shares, when sold, may be worth more or less than their original cost.
International investments carry additional risks, which include differences in financial reporting standards, currency exchange rates, political risks unique to a specific country, foreign taxes and regulations, and the potential for illiquid markets. These factors may result in greater share price volatility.
The Hang Seng Index is a benchmark index for the blue-chip stocks traded on the Hong Kong Stock Exchange. The KOSPI is an index of all stocks traded on the Korean Stock Exchange. The Nikkei 225 is a stock market index for the Tokyo Stock Exchange. The SENSEX is a stock market index of 30 companies listed on the Bombay Stock Exchange. The Jakarta Composite Index is an index of all stocks that are traded on the Indonesia Stock Exchange. The Bovespa Index tracks 50 stocks traded on the Sao Paulo Stock, Mercantile, & Futures Exchange. The IPC Index measures the companies listed on the Mexican Stock Exchange. The MERVAL tracks the performance of large companies based in Argentina. The ASX 200 Index is an index of stocks listed on the Australian Securities Exchange. The DAX is a market index consisting of the 30 German companies trading on the Frankfurt Stock Exchange. The CAC 40 is a benchmark for the 40 most significant companies on the French Stock Market Exchange. The Dow Jones Russia Index measures the performance of leading Russian Global Depositary Receipts (GDRs) that trade on the London Stock Exchange. The FTSE 100 Index is an index of the 100 companies with the highest market capitalization listed on the London Stock Exchange.
Please consult your financial professional for additional information.
Copyright 2023 FMG Suite.
1. WSJ.com, September 30, 2023
2. LipperAlpha.Refinitiv.com, August 25, 2023
3. FactSet.com, September 15, 2023
4. SectorSPDR.com, September 30, 2023
5. FederalReserve.gov, 2023
6. MSCI.com, September 30, 2023
7. MSCI.com, September 30, 2023
8. MSCI.com, September 30, 2023
9. MarketWatch.com, September 28, 2023
10. WSJ.com, September 1, 2023
11. Finance.Yahoo.com, September 14, 2023
12. MarketWatch.com, September 15, 2023
13. Bloomberg.com, September 19, 2023
14. CNBC.com, September 21, 2023
15. Morningstar.com, September 26, 2023
16. WSJ.com, September 13, 2023
17. WSJ.com, September 27, 2023
18. WSJ.com, September 20, 2023
19. Health.gov, 2023
20. BusinessInsider.com, January 1, 2023
21. Census.gov, 2023
22. WHO.int, 2023
23. CBO.gov, 2023
24. CDC.gov, 2023