U.S. Markets
Rising bond yields, geopolitical tensions, sticky inflation, and mixed earnings reports combined to push stocks lower last month.
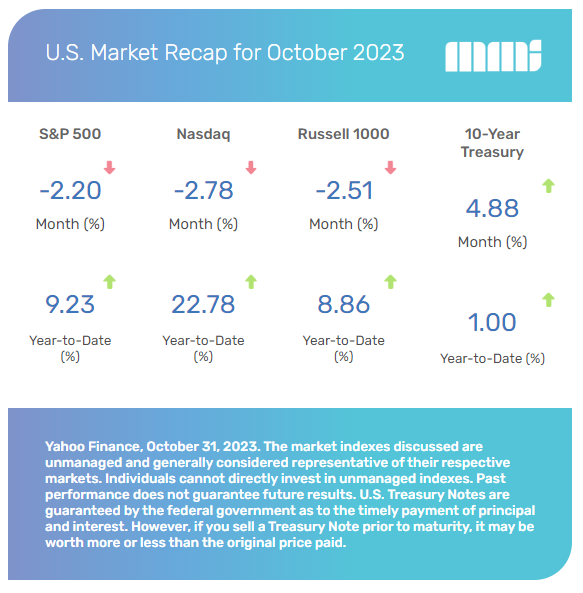
The Dow Jones Industrial Average fell 1.36 percent while the Standard & Poor’s 500 Index surrendered 2.20 percent. The Nasdaq Composite dropped 2.78 percent. [1]
Rising Bond Yields
Of the multiple headwinds that stocks battled last month, no two were stronger than rising bond yields and a fear of higher yields to come. Strong economic data throughout the month heightened fears that the Fed may raise rates further to cool the economy.
Inflation Updates
The inflation data last month didn’t help investor sentiment. Wholesale and consumer prices rose more than expected, which added to investor worry. The 10-year Treasury bond yield broke above 5.0 percent for the first time since 2007 and hovered near its 15-year high for the remainder of the month. [2]
No Relief from Earnings
After a difficult September, investors were eyeing the third-quarter earnings season to help lift a sluggish stock market. However, it didn’t happen as earnings proved mixed.
Through October 27, with 49 percent of the companies in the Standard & Poor’s 500 index reporting, 78 percent reported a positive earnings surprise. [3]
However, investors were disappointed by the decline in year-over-year net profit margins and discouraged by the forward guidance provided by reporting companies. The cautious guidance was largely attributed to current uncertainties, notably the potential widening of hostilities in the Middle East. [4]
A two-day rally at the month end was welcomed but unable to erase the month’s losses.
Sector Scorecard
Most industry sectors ended lower in October, including Communications Services (-1.30 percent), Consumer Discretionary (-5.52 percent), Consumer Staples (-1.38 percent), Energy (-5.75 percent), Financials (-2.44 percent) Health Care (-3.26 percent), Industrials (-2.98 percent), Materials (-3.17 percent), and Real Estate (-2.85 percent). The only sectors with a gain in October were Technology (+0.05 percent) and Utilities (+1.29 percent). [5]
What Investors May Be Talking About in December
As we move into the holiday shopping season, investors may be looking for early indications of just how strong the consumer is by gauging holiday shopping levels.
But what may cloud the holiday spending analysis is the growing trend of consumers beginning their holiday shopping in October or earlier to spread out the cost.
Holiday Shopping Trends
According to the National Retail Federation, 39 percent of consumers will begin their holiday shopping in November and nine percent will commence shopping in December. The others start their holiday shopping in October or earlier. However, Black Friday and Cyber Monday remain very strong days for holiday purchases. [6]
Keep these shopping trends in mind when you see consumer spending reports during the holiday season.
World Markets
The MSCI-EAFE Index fell 4.10 percent in October amid weak economic data in Europe and China with interest rate uncertainty contributing to the selling pressure. [7]
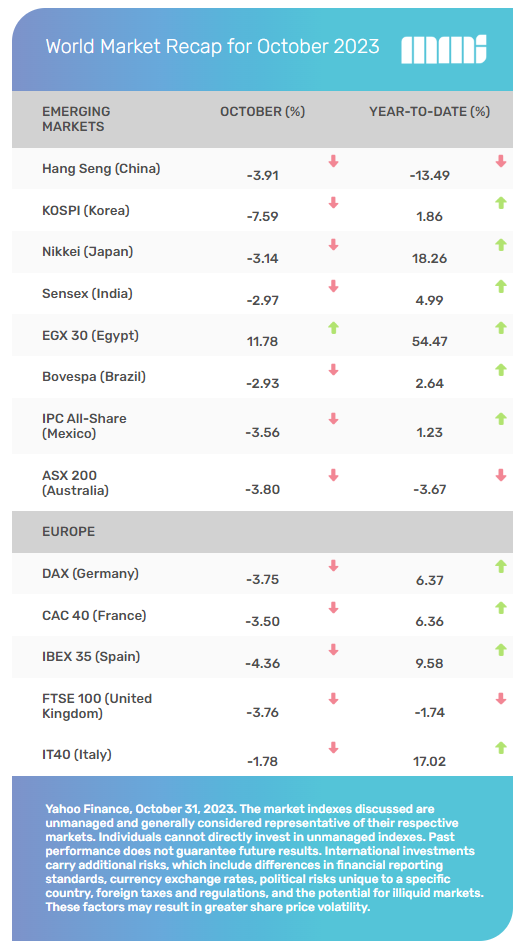
European stocks retreated, with declines experienced in France (-3.50 percent), Germany (-3.75 percent), Italy (-1.78 percent), Spain (-4.36 percent), and the U.K. (-3.76 percent). [8]
Pacific Rim markets also fell, with China’s Hang Seng index dropping 3.91 percent. Elsewhere, Australia lost 3.80 percent and Japan declined 3.14 percent. [9]
Indicators
Gross Domestic Product (GDP)
The U.S. economy grew by a 4.9 percent annualized rate in the third quarter, more than double the 2.1 percent expansion in the second quarter. Third-quarter growth was led by strong consumer spending and a rise in inventories. [10]
Employment
Nonfarm payrolls rose by 336,000 in September, exceeding the consensus forecast of a 170,000 increase. The previous two months’ reports were also revised higher by a combined 119,000. Wage growth came in at a modest 0.2 percent for the month and 4.2 percent year-over-year. The unemployment rate was 3.8 percent. [11]
Retail Sales
Retail sales increased 0.7 percent in September, exceeding the consensus forecast of 0.3 percent. Most categories were higher, except for electronics/appliances and clothing retailers, both of which decreased 0.8 percent month-over-month. [12]
Industrial Production
Industrial output rose 0.3 percent, beating expectations of a 0.1 percent increase. [13]
Housing
Housing starts were 7.0 percent higher versus August, though lower by 7.2 percent from September 2022. [14]
Existing homes sales fell 2.0 percent from August and 15.4 percent from last September, as higher mortgage rates affected affordability. [15]
New home sales gained 12.3 percent in September versus the previous month and up 34 percent from a year ago. The median price of new sales, however, declined from $433,100 in August to $418,800. [16]
Consumer Price Index (CPI)
The price of consumer goods rose 0.4 percent in September and 3.7 percent from 12-months ago. Both were above forecasts, though core inflation at 0.3 percent in September and 4.1 percent year-over-year met consensus estimates. [17]
Durable Goods Orders
Durable goods orders climbed 4.7 percent in September, far outpacing the 2.0 percent increase forecasted by economists and the 0.1 percent gain in August. [18]
The Fed
After keeping rates unchanged at the September Federal Open Market Committee meeting, the minutes revealed that Fed officials were divided over whether interest rates needed to be hiked further.
Though a majority of voting members indicated that it may be appropriate to raise the federal funds rate again, the October rise in bond yields may obviate the need for it. The minutes also pointed to a potential change in future communications, from how high to increase rates to how long to keep rates at restrictive levels. [19]
By the Numbers: Discovery of King Tutankhamun’s Tomb

Lighthouse Financial, LLC may be reached at www.lighthousefinancialllc.com, 303-444-1818 or wisdom@lighthousefinancialllc.com.
Investment and Advisory services are provided by Petra Financial Advisors, Inc., headquartered at 2 N. Nevada Ave. Suite 1300, Colorado Springs, CO 80903.
The content is developed from sources believed to be providing accurate information. The information in this material is not intended as tax or legal advice. Please consult legal or tax professionals for specific information regarding your individual situation. This material was developed and produced by FMG Suite to provide information on a topic that may be of interest. FMG Suite, LLC, is not affiliated with the named representative, broker-dealer, or state- or SEC-registered investment advisory firm. The opinions expressed and material provided are for general information and should not be considered a solicitation for the purchase or sale of any security.
Investing involves risks, and investment decisions should be based on your own goals, time horizon and tolerance for risk. The return and principal value of investments will fluctuate as market conditions change. When sold, investments may be worth more or less than their original cost.
Any companies mentioned are for illustrative purposes only. It should not be considered a solicitation for the purchase or sale of the securities. Any investment should be consistent with your objectives, timeframe, and risk tolerance.
The forecasts or forward-looking statements are based on assumptions, subject to revision without notice, and may not materialize.
The market indexes discussed are unmanaged and generally considered representative of their respective markets. Individuals cannot directly invest in unmanaged indexes. Past performance does not guarantee future results.
The Dow Jones Industrial Average is an unmanaged index that is generally considered representative of large-capitalization companies on the U.S. stock market. The S&P 500 Composite Index is an unmanaged group of securities considered to be representative of the stock market in general. The Nasdaq Composite is an index of the common stocks and similar securities listed on the Nasdaq stock market and considered a broad indicator of the performance of stocks of technology and growth companies. The Russell 1000 Index is an index that measures the performance of the highest-ranking 1,000 stocks in the Russell 3000 Index, which is comprised of 3,000 of the largest U.S. stocks. The MSCI EAFE Index was created by Morgan Stanley Capital International (MSCI) and serves as a benchmark for the performance in major international equity markets, as represented by 21 major MSCI indexes from Europe, Australia, and Southeast Asia. Index performance is not indicative of the past performance of a particular investment. Past performance does not guarantee future results. Individuals cannot invest directly in an index. The return and principal value of stock prices will fluctuate as market conditions change. And shares, when sold, may be worth more or less than their original cost.
International investments carry additional risks, which include differences in financial reporting standards, currency exchange rates, political risks unique to a specific country, foreign taxes and regulations, and the potential for illiquid markets. These factors may result in greater share price volatility.
The Hang Seng Index is a benchmark index for the blue-chip stocks traded on the Hong Kong Stock Exchange. The KOSPI is an index of all stocks traded on the Korean Stock Exchange. The Nikkei 225 is a stock market index for the Tokyo Stock Exchange. The SENSEX is a stock market index of 30 companies listed on the Bombay Stock Exchange. The Jakarta Composite Index is an index of all stocks that are traded on the Indonesia Stock Exchange. The Bovespa Index tracks 50 stocks traded on the Sao Paulo Stock, Mercantile, & Futures Exchange. The IPC Index measures the companies listed on the Mexican Stock Exchange. The MERVAL tracks the performance of large companies based in Argentina. The ASX 200 Index is an index of stocks listed on the Australian Securities Exchange. The DAX is a market index consisting of the 30 German companies trading on the Frankfurt Stock Exchange. The CAC 40 is a benchmark for the 40 most significant companies on the French Stock Market Exchange. The Dow Jones Russia Index measures the performance of leading Russian Global Depositary Receipts (GDRs) that trade on the London Stock Exchange. The FTSE 100 Index is an index of the 100 companies with the highest market capitalization listed on the London Stock Exchange.
Please consult your financial professional for additional information.
Copyright 2023 FMG Suite.
1. WSJ.com, October 31, 2023
2. APNews.com, October 23, 2023
3. FactSet.com, October 27, 2023
4. FactSet.com, October 27, 2023
5. SectorSPDR.com, October 31, 2023
6. NRF.com, October 5, 2023
7. MSCI.com, October 31, 2023
8. MSCI.com, October 31, 2023
9. MSCI.com, October 31, 2023
10. CNBC.com, October 26, 2023
11. CNBC.com, October 6, 2023
12. CNBC.com, October 17, 2023
13. CNBC.com, October 17, 2023
14. CNN.com, October 18, 2023
15. WSJ.com, October 19, 2023
16. Morningstar.com, October 25, 2023
17. CNBC.com, October 12, 2023
18. CNBC.com, October 26, 2023
19. WSJ.com, October 11, 2023
20. History.com, November 1, 2022
21. FoxNews.com, November 3, 2022
22. LiveScience.com, November 14, 2022
23. NationalGeographic.com, March 2023