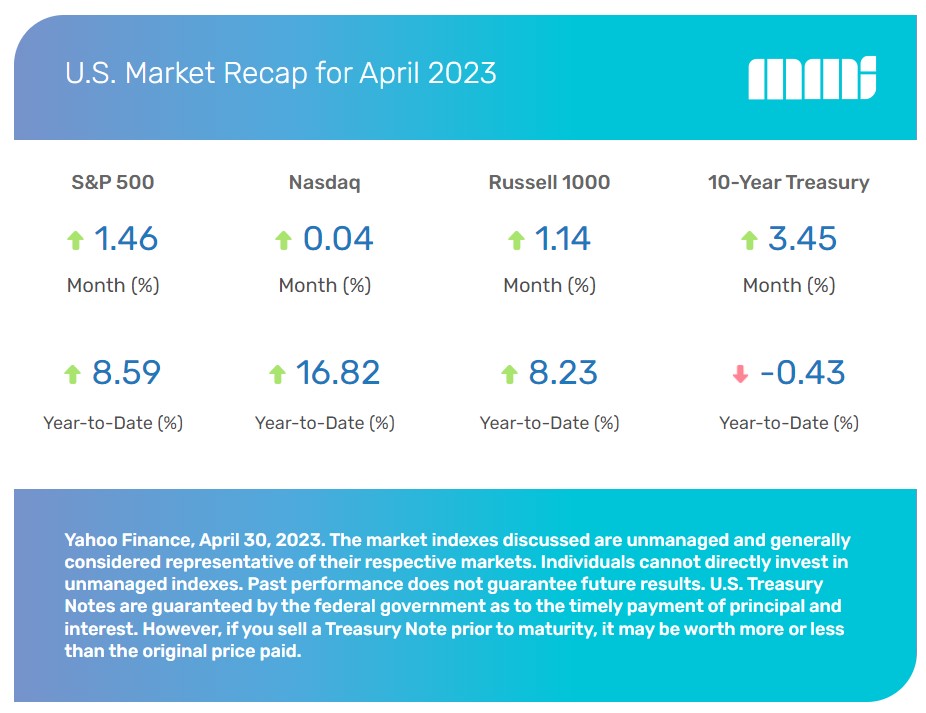
U.S. Markets
The Dow Jones Industrial Average led, picking up 2.48 percent. The Standard & Poor’s 500 Index rose 1.46 percent, while the Nasdaq Composite was flat (+0.04 percent).(1)
Recession Watch
While the start of the year revolved around the direction of Fed monetary policy, investors in April began to turn their focus toward the economic impact of the Fed’s year-long series of steep rate hikes.
Throughout the month, growing fears of a recession were bolstered by weak economic data, anemic manufacturing reports, ongoing softness in the housing market, and another monthly decline in leading economic indicators.
Inflation Update
Inflation was a bright spot, however. Consumer prices continued to decrease in a meaningful way, while producer prices—a potential indicator of future consumer prices—also fell, providing some positive relief to investors. Nevertheless, inflation remained above the Fed’s target rate of two percent, and many worried that inflation may remain sticky at these elevated levels.(2)
Earnings Update
The first-quarter earnings season commenced in April with much foreboding. Earnings estimates had been cut in the preceding months as Wall Street analysts considered a slowing economy and waning consumer strength. So far, the results have not confirmed the worst fears of investors, but there has been little to excite investors.
Through April 28, with 53 percent of the companies comprising the S&P 500 Index reporting, 79 percent reported profits above estimates (slightly above the five-year average of 77 percent). In total, 20 S&P companies issued positive guidance, while 28 delivered a negative outlook. Despite these mixed results, the first quarter is off to a relatively better start than the previous two quarters.(3)
Mega-Cap Tech Names
Positive earnings results from several mega-cap technology companies ignited strong gains in the closing days of the final week of trading, solidifying the month’s gains.
Sector Scorecard
All but one sector rallied, with gains posted in Consumer Staples (+3.68 percent), Energy (+1.29 percent), Financials (+2.00 percent), Health Care (+2.89 percent), Utilities (+2.17 percent), Communications Services (+3.72 percent), Consumer Discretionary (+0.14 percent), Materials (+0.26 percent), Technology (+0.34 percent), and Real Estate (+1.58). Meanwhile, Industrials lost 1.52 percent.(4)
What Investors May Be Talking About in May
May kicked off with the conclusion of another Federal Open Market Committee (FOMC) meeting, which may set up a debate about what factors will drive the Fed’s next move with interest rates.
Investor attention may be higher than usual on data that typically do not make headline news, such as the Purchasing Managers’ Index Composite, the Index of Leading Economic Indicators, the Consumer Sentiment Index, and the Institute for Supply Management (ISM) Manufacturing and Services indexes.
Investors may even seek to parse the Fed’s reports on regional manufacturing activity to gauge economic health. Of course, some headline reports will still be watched closely, like those on retail sales and housing.
Also, expect some attention to shift to lending activity by banks, which has fallen since regional banking stresses surfaced in March. Should lending continue to decline, it could portend economic slowdown as businesses and consumers lose access to credit.(5)
World Markets
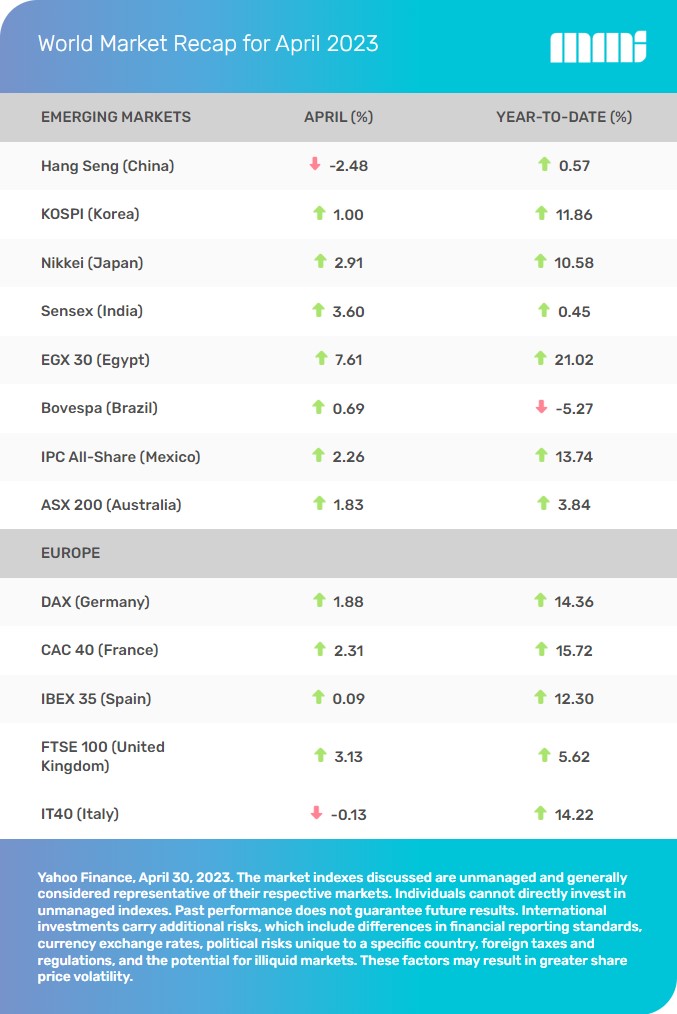
The MSCI EAFE Index gained 1.95 percent in April as resilient economic data outweighed a tightening monetary environment.(6)
European markets were mostly higher, with the U.K. adding 3.13 percent, France tacking on 2.31 percent, and Germany climbing by 1.88 percent. Spain and Italy were flat for the month.(7)
Pacific Rim markets were also mostly higher, with Japan gaining 2.92 percent and Australia picking up 1.83 percent. However, China’s Hang Seng Index lost 2.48 percent.(8)
Indicators
Gross Domestic Product (GDP)
The initial estimate was that first-quarter GDP rose at an annualized rate of 1.1 percent, as solid consumer spending helped offset a decline in business investment and a deceleration in nonresidential investment. Economists estimated 2 percent economic growth.(9)
Employment
Employers added 236,000 workers in March, the lowest number in over two years. The unemployment rate fell to 3.5 percent. Wage gains continued to moderate as the three-month annualized rate of growth in hourly income (+3.2 percent) fell below pre-pandemic levels.(10)
Retail Sales
Consumer spending at retail stores and restaurants declined by 1.0 percent as consumers slowed their purchasing of autos, electronics, and home and garden items. It was the second consecutive month of contracting retail sales.(11)
Industrial Production
Industrial production rose by 0.4 percent in March, driven by a surge in the utility sector as consumers used more heating in response to cold weather. The mining and manufacturing sectors both experienced declines.(12)
Housing
Housing starts slipped by 0.8 percent in March, dragged lower by a 5.9-percent decline in multifamily dwelling starts. Single-family home construction increased by 2.7 percent. Permit applications to build fell by 8.8 percent, possibly indicating continued softness.(13)
Sales of existing homes slid 2.4 percent from February and 22.0 percent from March 2022 as higher mortgage rates and low inventory impacted affordability.(14)
New home sales jumped 9.6 percent to reach their highest level since March 2022. The median price of March 2023 new home sales was $449,800, a 3.2 percent rise from last year.(15)
Consumer Price Index (CPI)
The prices consumers paid for goods and services cooled in March, rising just 0.1 percent versus the consensus forecast of 0.2 percent. The year-over-year inflation rate also moderated to 5.0 percent, down from 6.0 percent in February. Decreases in food and energy, along with smaller gains in shelter costs, were the primary reasons for the lower headline inflation number.(16)
Durable Goods Orders
Durable goods orders rose by 3.2 percent but increased by a smaller amount (+0.3 percent) excluding passenger plane orders.(17)
The Fed
Minutes from the Federal Open Market Committee (FOMC) March meeting were released on April 12. The minutes indicated that the Fed may raise rates at least one more time, citing continuing price pressures and labor market strength.(18)
The minutes pointed out that a number of officials were in favor of a half-point increase in March but settled on a quarter-point hike due to the uncertainty created by banking stresses that surfaced in March.18
The minutes also indicated that the probability of a recession increased as a result of the banking crisis. Fed officials expressed concerns that a recession may occur sometime later in the year. (18)
Lighthouse Financial, LLC may be reached at www.lighthousefinancialllc.com, 303-444-1818 or wisdom@lighthousefinancialllc.com.
Investment and Advisory services are provided by Petra Financial Advisors, Inc., headquartered at 2 N. Nevada Ave. Suite 1300, Colorado Springs, CO 80903.
The content is developed from sources believed to be providing accurate information. The information in this material is not intended as tax or legal advice. Please consult legal or tax professionals for specific information regarding your individual situation. This material was developed and produced by FMG Suite to provide information on a topic that may be of interest. FMG Suite, LLC, is not affiliated with the named representative, broker-dealer, or state- or SEC-registered investment advisory firm. The opinions expressed and material provided are for general information and should not be considered a solicitation for the purchase or sale of any security.
Investing involves risks, and investment decisions should be based on your own goals, time horizon and tolerance for risk. The return and principal value of investments will fluctuate as market conditions change. When sold, investments may be worth more or less than their original cost.
Any companies mentioned are for illustrative purposes only. It should not be considered a solicitation for the purchase or sale of the securities. Any investment should be consistent with your objectives, timeframe, and risk tolerance.
The forecasts or forward-looking statements are based on assumptions, subject to revision without notice, and may not materialize.
The market indexes discussed are unmanaged and generally considered representative of their respective markets. Individuals cannot directly invest in unmanaged indexes. Past performance does not guarantee future results.
The Dow Jones Industrial Average is an unmanaged index that is generally considered representative of large-capitalization companies on the U.S. stock market. The S&P 500 Composite Index is an unmanaged group of securities considered to be representative of the stock market in general. The Nasdaq Composite is an index of the common stocks and similar securities listed on the Nasdaq stock market and considered a broad indicator of the performance of stocks of technology and growth companies. The Russell 1000 Index is an index that measures the performance of the highest-ranking 1,000 stocks in the Russell 3000 Index, which is comprised of 3,000 of the largest U.S. stocks. The MSCI EAFE Index was created by Morgan Stanley Capital International (MSCI) and serves as a benchmark for the performance in major international equity markets, as represented by 21 major MSCI indexes from Europe, Australia, and Southeast Asia. Index performance is not indicative of the past performance of a particular investment. Past performance does not guarantee future results. Individuals cannot invest directly in an index. The return and principal value of stock prices will fluctuate as market conditions change. And shares, when sold, may be worth more or less than their original cost.
International investments carry additional risks, which include differences in financial reporting standards, currency exchange rates, political risks unique to a specific country, foreign taxes and regulations, and the potential for illiquid markets. These factors may result in greater share price volatility.
The Hang Seng Index is a benchmark index for the blue-chip stocks traded on the Hong Kong Stock Exchange. The KOSPI is an index of all stocks traded on the Korean Stock Exchange. The Nikkei 225 is a stock market index for the Tokyo Stock Exchange. The SENSEX is a stock market index of 30 companies listed on the Bombay Stock Exchange. The Jakarta Composite Index is an index of all stocks that are traded on the Indonesia Stock Exchange. The Bovespa Index tracks 50 stocks traded on the Sao Paulo Stock, Mercantile, & Futures Exchange. The IPC Index measures the companies listed on the Mexican Stock Exchange. The MERVAL tracks the performance of large companies based in Argentina. The ASX 200 Index is an index of stocks listed on the Australian Securities Exchange. The DAX is a market index consisting of the 30 German companies trading on the Frankfurt Stock Exchange. The CAC 40 is a benchmark for the 40 most significant companies on the French Stock Market Exchange. The Dow Jones Russia Index measures the performance of leading Russian Global Depositary Receipts (GDRs) that trade on the London Stock Exchange. The FTSE 100 Index is an index of the 100 companies with the highest market capitalization listed on the London Stock Exchange.
Please consult your financial professional for additional information.
Copyright 2023 FMG Suite.
- WSJ.com, April 30, 2023
- CNBC.com, April 12, 2023
- Insight.FactSet.com, April 28, 2023
- SectorSPDR.com, April 30, 2023
- NPR.org, April 10, 2023
- MSCI.com, April 30, 2023
- MSCI.com, April 30, 2023
- MSCI.com, April 30, 2023
- CNBC.com, April 27, 2023
- WSJ.com, April 7, 2023
- CNBC.com, April 14, 2023
- Morningstar.com, April 14, 2023
- Finance.Yahoo.com, April 18, 2023
- CNBC.com, April 20, 2023
- Finance.Yahoo.com, April 25, 2023
- CNBC.com, April 12, 2023
- Morningstar.com, April 26, 2023
- CNBC.com, April 12, 2023