Highlights of the latest trends and developments influencing the financial market.
U.S. Markets
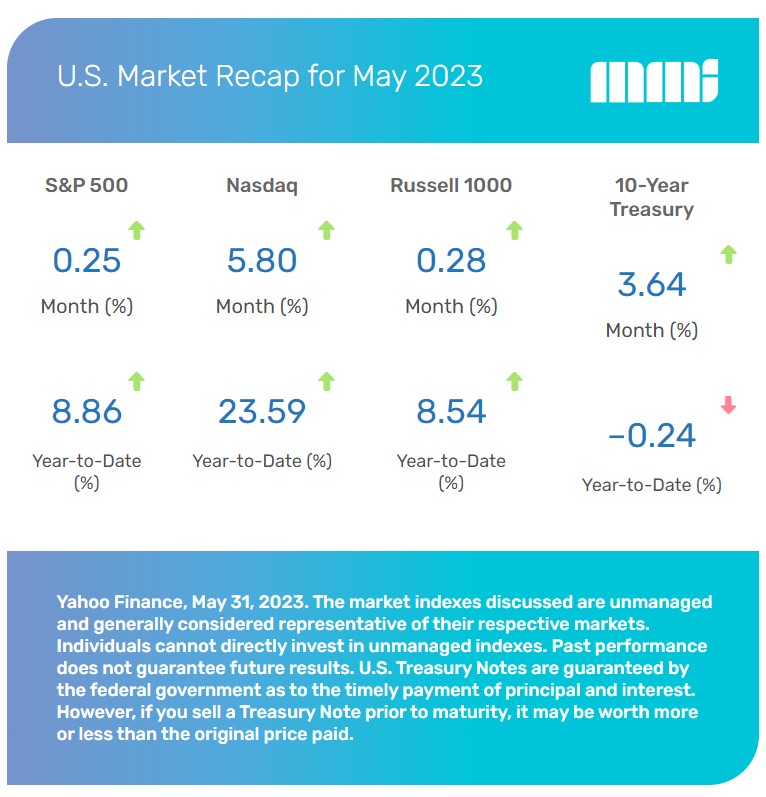
Stock prices were mixed as enthusiasm over the economic potential of artificial intelligence was offset by concerns about the federal debt ceiling.
The Dow Jones Industrial Average lost 3.49 percent, while the Standard & Poor’s 500 Index notched a slight gain, adding 0.25 percent. The Nasdaq Composite led, picking up 5.80 percent.(1)
Prevailing Headwinds
Stocks navigated several headwinds, including talk of another Fed rate hike, concerns about regional banking stresses, and ongoing recession fears. But the most challenging headwind for the market was the uncertainty surrounding the national debt ceiling.
Debt Ceiling Talks
The political brinkmanship surrounding the talks was unsettling for the financial markets. Stocks were held captive to the ebb and flow of updates, falling when lawmakers’ talks faltered and rising when an agreement seemed near. As the month closed, the debt ceiling measure appeared close to the finish line.(2)
Upbeat Corporate Reports
One source of support for stocks last month was first-quarter corporate reports, which exceeded the market’s low expectations. With 97 percent of the companies comprising the S&P 500 reporting, 78 percent reported a positive earnings surprise. This is the best performance relative to Wall Street estimates since the fourth quarter of 2021.
AI Movement
This corporate earnings season ushered in a dramatic development—a heightened focus on artificial intelligence (AI). In an analysis of earnings calls, 110 companies mentioned AI, representing a 40 percent increase from the fourth quarter.(4)
One mega-cap chip company reported above-consensus earnings along with strong guidance due to its AI-related business, igniting investor enthusiasm that rippled across the technology and communication services sectors as May came to a close.(4)
Sector Scorecard
Three industry sectors ended the month with gains: Communications Services (+4.87 percent), Consumer Discretionary (+3.54 percent), and Technology (+10.39 percent). Losses were seen in Consumer Staples (–5.89 percent), Energy (–8.13 percent), Financials (–2.18 percent), Healthcare (–4.42 percent), Industrials (–1.12 percent), Materials (–5.26 percent), Real Estate (–3.99 percent), and Utilities (–6.55 percent).(5)
What Investors May Be Talking About in June
The Federal Open Market Committee (FOMC) will close its two-day meeting on June 14 and update investors on the direction of short-term rates.
At its May 2023 meeting, the FOMC announced a 25 basis point hike, adding that Committee members may decide to pause on future rate hikes, depending on fresh economic data and prevailing financial conditions.
But the market believes that the Fed will raise interest rates at least another 25 basis points this summer, perhaps as soon as this month.(6)
FOMC meetings have been important events in the markets for the last two years, and this upcoming one is no different.
World Markets
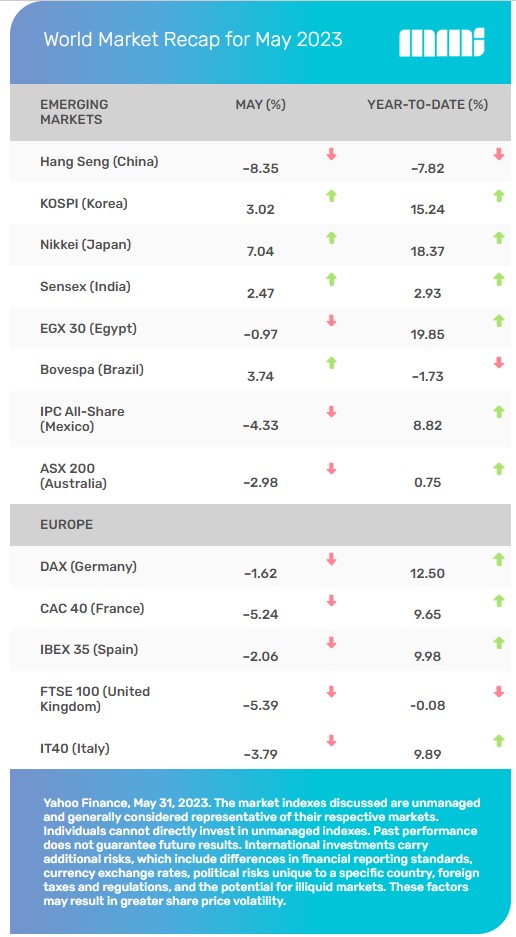
The MSCI-EAFE Index slid 4.76 percent in May as Germany’s economy entered a recession and China’s most recent reopening efforts struggled.(7)
European markets were under pressure most of the month. At the end of May trading, France lost 5.24 percent, the U.K. dropped 5.39 percent, and Italy fell 3.79 percent.(8)
Pacific Rim markets mixed. China’s Hang Seng index dropped 8.35 percent, while Japan’s Nikkei rose 7.04 percent.(9)
Indicators
Gross Domestic Product (GDP)
The second estimate of first-quarter GDP growth was revised higher, from 1.1 percent to 1.3 percent.(10)
Employment
Employers added 253,000 jobs in April, as the unemployment rate fell to 3.4 percent. Wages rose 4.4 percent year over year. April’s job growth number was offset by a downward revision of 149,000 in the February and March estimates.(11)
Retail Sales
Retail sales increased 0.4 percent in April, up from a revised 0.7 percent decline in March. It was the first increase since January.(12)
Industrial Production
Industrial production rose 0.5 percent in April, led by an increase in manufacturing activity. Capacity utilization rose to 79.7 percent, in line with its long-term average.(13)
Housing
Housing starts climbed 2.2 percent, an encouraging report that was offset by a downward revision of the March number.(14)
Sales of existing homes fell 3.4 percent in April and were lower by 23.2 percent from a year earlier. The median price of existing home sales fell 1.7 percent from April 2022, the largest year-over-year decline in more than 11 years.(15)
New home sales gained 4.1 percent. Economists expected a 2.0 percent decline. Sales of new homes were 11.8 percent above those of April 2022.(16)
Consumer Price Index (CPI)
Year-over-year inflation cooled to 4.9 percent, down slightly from March’s 5.0 percent increase. It was the tenth straight month in which price inflation fell. April’s monthly increase in prices was 0.4 percent, which was in line with expectations, although higher than the 0.1 percent increase in March.(17)
Durable Goods Orders
New orders for durable goods rose 1.1 percent in April, beating the consensus forecast of a decline of 0.8 percent. The gains were driven by defense spending and business investment.(18)
The Fed
After raising interest rates by 0.25 percent at the start of May, the minutes from the Federal Open Market Committee indicated a division among committee members over whether further rate hikes would be necessary.(19)
The majority of them signaled that they were ready for a pause. Members supporting another rate hike believed that the progress on inflation was moving too slowly in reaching the Fed’s target inflation rate of 2 percent.(19)
Lighthouse Financial, LLC may be reached at www.lighthousefinancialllc.com, 303-444-1818 or wisdom@lighthousefinancialllc.com.
Investment and Advisory services are provided by Petra Financial Advisors, Inc., headquartered at 2 N. Nevada Ave. Suite 1300, Colorado Springs, CO 80903.
The content is developed from sources believed to be providing accurate information. The information in this material is not intended as tax or legal advice. Please consult legal or tax professionals for specific information regarding your individual situation. This material was developed and produced by FMG Suite to provide information on a topic that may be of interest. FMG Suite, LLC, is not affiliated with the named representative, broker-dealer, or state- or SEC-registered investment advisory firm. The opinions expressed and material provided are for general information and should not be considered a solicitation for the purchase or sale of any security.
Investing involves risks, and investment decisions should be based on your own goals, time horizon and tolerance for risk. The return and principal value of investments will fluctuate as market conditions change. When sold, investments may be worth more or less than their original cost.
Any companies mentioned are for illustrative purposes only. It should not be considered a solicitation for the purchase or sale of the securities. Any investment should be consistent with your objectives, timeframe, and risk tolerance.
The forecasts or forward-looking statements are based on assumptions, subject to revision without notice, and may not materialize.
The market indexes discussed are unmanaged and generally considered representative of their respective markets. Individuals cannot directly invest in unmanaged indexes. Past performance does not guarantee future results.
The Dow Jones Industrial Average is an unmanaged index that is generally considered representative of large-capitalization companies on the U.S. stock market. The S&P 500 Composite Index is an unmanaged group of securities considered to be representative of the stock market in general. The Nasdaq Composite is an index of the common stocks and similar securities listed on the Nasdaq stock market and considered a broad indicator of the performance of stocks of technology and growth companies. The Russell 1000 Index is an index that measures the performance of the highest-ranking 1,000 stocks in the Russell 3000 Index, which is comprised of 3,000 of the largest U.S. stocks. The MSCI EAFE Index was created by Morgan Stanley Capital International (MSCI) and serves as a benchmark for the performance in major international equity markets, as represented by 21 major MSCI indexes from Europe, Australia, and Southeast Asia. Index performance is not indicative of the past performance of a particular investment. Past performance does not guarantee future results. Individuals cannot invest directly in an index. The return and principal value of stock prices will fluctuate as market conditions change. And shares, when sold, may be worth more or less than their original cost.
International investments carry additional risks, which include differences in financial reporting standards, currency exchange rates, political risks unique to a specific country, foreign taxes and regulations, and the potential for illiquid markets. These factors may result in greater share price volatility.
The Hang Seng Index is a benchmark index for the blue-chip stocks traded on the Hong Kong Stock Exchange. The KOSPI is an index of all stocks traded on the Korean Stock Exchange. The Nikkei 225 is a stock market index for the Tokyo Stock Exchange. The SENSEX is a stock market index of 30 companies listed on the Bombay Stock Exchange. The Jakarta Composite Index is an index of all stocks that are traded on the Indonesia Stock Exchange. The Bovespa Index tracks 50 stocks traded on the Sao Paulo Stock, Mercantile, & Futures Exchange. The IPC Index measures the companies listed on the Mexican Stock Exchange. The MERVAL tracks the performance of large companies based in Argentina. The ASX 200 Index is an index of stocks listed on the Australian Securities Exchange. The DAX is a market index consisting of the 30 German companies trading on the Frankfurt Stock Exchange. The CAC 40 is a benchmark for the 40 most significant companies on the French Stock Market Exchange. The Dow Jones Russia Index measures the performance of leading Russian Global Depositary Receipts (GDRs) that trade on the London Stock Exchange. The FTSE 100 Index is an index of the 100 companies with the highest market capitalization listed on the London Stock Exchange.
Please consult your financial professional for additional information.
Copyright 2023 FMG Suite.
1. WSJ.com, May 31, 2023
2. CNBC.com, May 31, 2023
3. Insight.FactSet.com, May 26, 2023
4. Insight.FactSet.com, May 26, 2023
5. SectorSPDR.com, May 31, 2023
6. CMEGroup.com, May 31, 2023
7. MSCI.com, May 31, 2023
8. MSCI.com, May 31, 2023
9. MSCI.com, May 31, 2023
10. TradingEconomics.com, May 25, 2023
11. CNBC.com, May 5, 2023
12. CNBC.com, May 16, 2023
13. Reuters.com, May 16, 2023
14. Reuters.com, May 17, 2023
15. CNBC.com, May 18, 2023
16. Finance.Yahoo.com, May 23, 2023
17. CNBC.com, May 10, 2023
18. Census.gov, May 26, 2023
19. Reuters.com, May 24, 2023
20. WHO.int, May 26, 2022
21. Healthline.com, February 28, 2022