U.S. Markets
Stocks fell in the first quarter as investors contended with economic uncertainty, inflationary concerns, and evolving tariff talks.
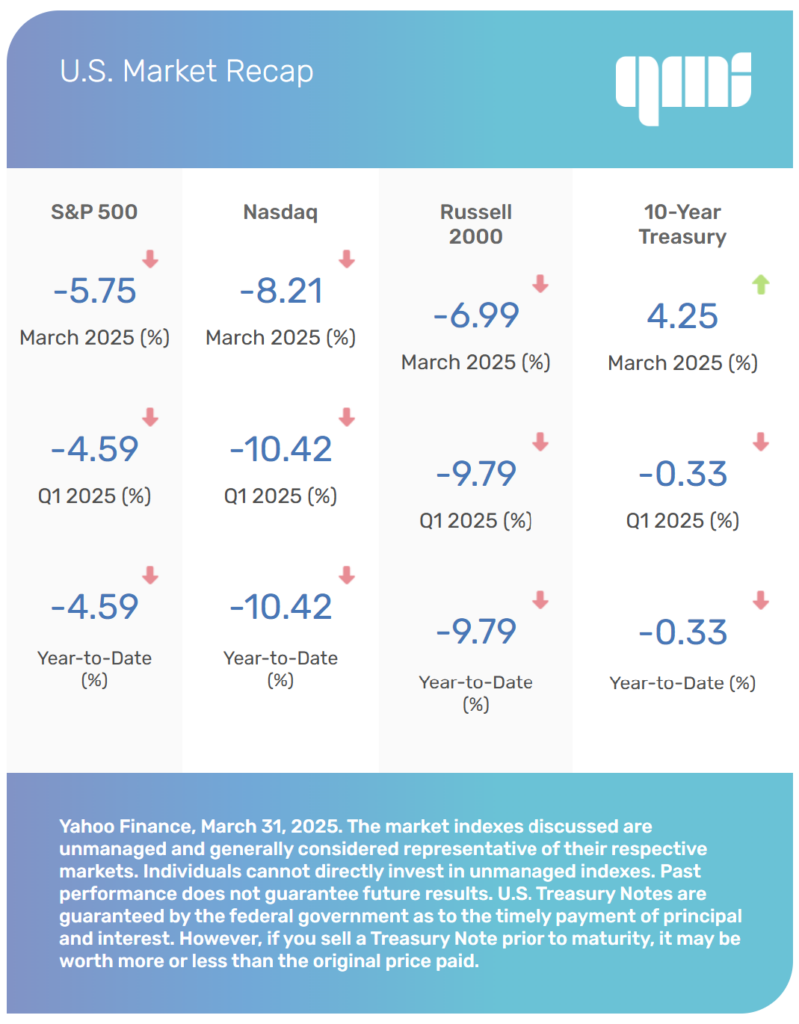
The Standard & Poor’s 500 Index slid 4.59 percent, while the tech-heavy Nasdaq Composite dropped 10.42 percent. The Dow Jones Industrial Average fared best, sliding only 1.28 percent. [1]
January’s Black Swan
Stocks rallied in January on upbeat business and economic messaging from the White House. However, tech stocks pulled markets lower later in the month on news that a Chinese start-up had developed a competitive artificial intelligence (AI) model that performed as well as its Western counterparts at a fraction of the cost.2
As the month came to a close, investors evaluated whether it was indeed a “black swan” event or just another development in the fast-moving world of AI. [2]
February’s New High
Stocks hit new highs following February’s Presidents’ Day holiday. But stubborn inflation, mixed economic signals, and an evolving trade policy tempered enthusiasm. As the month came to a close, an upbeat inflation report led to a powerful rally, which helped limit losses. [3,4]
Ongoing Trade Talks in March
March was a different story, however. Stocks trended lower throughout the month as fast-moving trade policy updates unnerved investors. Things improved slightly by mid-month as a choppy rally attempt tried to take shape. But sellers gained the upper hand in the final full week of trading on a mixed inflation report and souring consumer sentiment. [5]
Sector Scorecard
During Q1, four of the 11 S&P 500 sectors fell–but those four disproportionately affected the index. Technology, for example, is about 30 percent of the S&P 500. [6]
Consumer Discretionary (-11.99 percent), which is about 11 percent of the S&P 500 index, and Technology (-11.20 percent) were under the most pressure. Industrials (-0.52 percent) and Communication Services (-0.37 percent) also posted losses. Industrials comprise 7 percent of the index, and Communication Services comprise 10 percent. [6]
Energy (+9.09 percent) was the best-performing sector. Utilities (+4.17 percent), Healthcare (+6.14 percent), Consumer Staples (+3.89 percent), Financials (+3.06 percent), Real Estate (+2.90 percent), and Materials (+2.19 percent) all ended the quarter higher. [6]
What Investors May Be Talking About in April
In the month ahead, companies will start to release their Q1 corporate reports, which may provide some insights into what will drive the economy in the future.
One of the best ways to understand chief executive officers’ thoughts is to analyze the words or terms they use during their conference calls with shareholders.
In Q4 2024, 241 of the S&P 500 companies cited the term “AI” during their calls. By contrast, only 13 mentioned the word “recession,” the lowest level since Q1 2018. [7,8]
Two-hundred and thirty CEOs cited the term in Q4, which is down from more than 400 in Q1 2022. [9]
World Markets
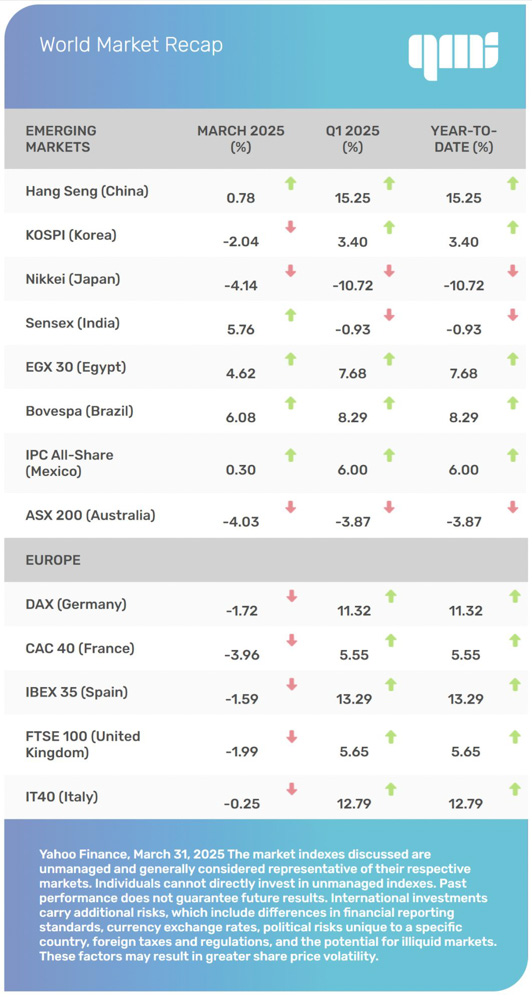
The MSCI EAFE Index gained 6.15 percent during Q1, outperforming all three major U.S. market averages. [10]
European markets had a strong quarter. Spain (+13.29 percent), Italy (+12.79 percent), Germany (+11.32 percent), and France (+5.55 percent) all posted solid gains. The United Kingdom also had a good quarter, picking up 5.65 percent. [10]
Pacific Rim markets were mixed. Japan’s Nikkei index lost 10.72 percent, and Australia’s ASX 200 fell 3.87 percent. Meanwhile, China’s Hang Seng index rose 15.25 percent, and Korea’s KOSPI added 3.40 percent. [10]
Indicators
Gross Domestic Product (GDP)
The economy grew at an annualized 2.4 percent in Q4, revised up from the prior estimate of 2.3 percent but just shy of economists’ expectations of 2.5 percent. For the full year, GDP grew 2.5 percent, compared with 3.2 percent growth in 2023. The fourth quarter marked the ninth of the past 10 quarters in which year-over-year GDP growth exceeded 2 percent. [11,12]
Employment
Employers added 151,000 jobs in February, below the forecast of 170,000 jobs. Unemployment increased to an annualized 4.1 percent in February over the prior month. Wage growth rose 0.3 percent in February, as expected. [13]
Retail Sales
Consumer spending rose 0.2 percent in February, short of economists’ expectations of a 0.6 percent increase. [14]
Industrial Production
Industrial output rose 1.4 percent year-over-year in February, following a downwardly revised 1.9 percent rise in January. [15]
Housing
Housing starts rose 11.2 percent in February over the prior month, driven by solid demand and limited existing inventory. The increase exceeded market expectations and followed January’s 11.5 percent decline, which was driven primarily by weather-related disruptions in construction activity. [16]
Sales of existing homes rose 4.2 percent in February, beating expectations of a 3.2 percent drop as buyers moved off the sidelines. The median existing home sales price was $398,400, a 3.8 percent rise from a year prior. [17]
New home sales rose 1.8 percent in February. Year over year, new home sales rose by 5.1 percent. There were 500,000 unsold new homes on the market in February, the highest inventory level since November 2007 and equal to 8.9 months of supply at the current sales pace. [18]
Consumer Price Index (CPI)
Consumer prices rose 0.2 percent in February, cooler than expected and at a slower pace than January’s 0.5 percent rise. Year over year, prices rose 2.8 percent, also less than expected. Core inflation, which excludes volatile food and energy prices, also rose 0.2 percent month over month and 3.1 percent year over year—both less than expected. [19]
Durable Goods Orders
Orders of manufactured goods designed to last three years or longer rose 0.9 percent in February, beating economists’ expectations for a 1 percent drop. [20]
The Fed
The Federal Open Market Committee (FOMC) held rates steady at both of its meetings in Q1.
Testifying before the Senate Banking Committee on February 10, Chair Powell told lawmakers the Fed doesn’t “need to be in a hurry” to lower interest rates further, given the economy was currently “strong overall.” [21]
At its March meeting, Fed Chair Jerome Powell acknowledged that progress toward their 2 percent inflation target is “probably delayed for the time being.” He said that the Fed maintains its wait-and-see stance toward tariffs and their longer-term impact on inflation. [22]
The FOMC’s next meeting is scheduled for May 6-7. [22]
By the Numbers: Gardening
Lighthouse Financial, LLC may be reached at www.lighthousefinancialllc.com, 303-444-1818 or wisdom@lighthousefinancialllc.com.
Investment and Advisory services are provided by Petra Financial Advisors, Inc., headquartered at 2 N. Nevada Ave. Suite 1300, Colorado Springs, CO 80903.
The content is developed from sources believed to be providing accurate information. The information in this material is not intended as tax or legal advice. Please consult legal or tax professionals for specific information regarding your individual situation. This material was developed and produced by FMG Suite to provide information on a topic that may be of interest. FMG Suite, LLC, is not affiliated with the named representative, broker-dealer, or state- or SEC-registered investment advisory firm. The opinions expressed and material provided are for general information and should not be considered a solicitation for the purchase or sale of any security.
Investing involves risks, and decisions should be based on your goals, time horizon, and tolerance for risk. The return and principal value of investments will fluctuate as market conditions change. When sold, investments may be worth more or less than their original cost.
Any companies mentioned are for illustrative purposes only. It should not be considered a solicitation for the purchase or sale of the securities. Any investment should be consistent with your objectives, timeframe, and risk tolerance.
The forecasts or forward-looking statements are based on assumptions, subject to revision without notice, and may not materialize.
The market indexes discussed are unmanaged and generally considered representative of their respective markets. Individuals cannot directly invest in unmanaged indexes. Past performance does not guarantee future results.
The Dow Jones Industrial Average is an unmanaged index that is generally considered representative of large-capitalization companies on the U.S. stock market. The S&P 500 Composite Index is an unmanaged group of securities considered to be representative of the stock market in general. The Nasdaq Composite is an index of the common stocks and similar securities listed on the Nasdaq stock market and considered a broad indicator of the performance of stocks of technology and growth companies. The Russell 1000 Index is an index that measures the performance of the highest-ranking 1,000 stocks in the Russell 3000 Index, which is comprised of 3,000 of the largest U.S. stocks. The MSCI EAFE Index was created by Morgan Stanley Capital International (MSCI) and serves as a benchmark for the performance in major international equity markets, as represented by 21 major MSCI indexes from Europe, Australia, and Southeast Asia. Index performance is not indicative of the past performance of a particular investment. Past performance does not guarantee future results. Individuals cannot invest directly in an index. The return and principal value of stock prices will fluctuate as market conditions change. And shares, when sold, may be worth more or less than their original cost.
International investments carry additional risks, which include differences in financial reporting standards, currency exchange rates, political risks unique to a specific country, foreign taxes and regulations, and the potential for illiquid markets. These factors may result in greater share price volatility.
The Hang Seng Index is a benchmark index for the blue-chip stocks traded on the Hong Kong Stock Exchange. The KOSPI is an index of all stocks traded on the Korean Stock Exchange. The Nikkei 225 is a stock market index for the Tokyo Stock Exchange. The SENSEX is a stock market index of 30 companies listed on the Bombay Stock Exchange. The Jakarta Composite Index is an index of all stocks that are traded on the Indonesia Stock Exchange. The Bovespa Index tracks 50 stocks traded on the Sao Paulo Stock, Mercantile, & Futures Exchange. The IPC Index measures the companies listed on the Mexican Stock Exchange. The MERVAL tracks the performance of large companies based in Argentina. The ASX 200 Index is an index of stocks listed on the Australian Securities Exchange. The DAX is a market index consisting of the 30 German companies trading on the Frankfurt Stock Exchange. The CAC 40 is a benchmark for the 40 most significant companies on the French Stock Market Exchange. The Dow Jones Russia Index measures the performance of leading Russian Global Depositary Receipts (GDRs) that trade on the London Stock Exchange. The FTSE 100 Index is an index of the 100 companies with the highest market capitalization listed on the London Stock Exchange.
Please consult your financial professional for additional information.
Copyright 2025 FMG Suite.
- WSJ.com, March 31, 2025
- CNBC.com, January 27, 2025
- CNBC.com, February 19, 2025
- WSJ.com, February 28, 2025
- WSJ.com, March 28, 2025
- Sectorspdrs.com, March 31, 2025
- Insight.FactSet.com, March 14, 2025
- Insight.FactSet.com, March 10, 2025
- Insight.FactSet.com, March 17, 2025
- MSCI, March 31, 2025
- MarketWatch.com, March 27, 2025
- The Wall Street Journal, January 30, 2025
- CNBC.com, March 7, 2025
- Tradingeconomics.com, March 17, 2025
- Tradingeconomics.com, March 18, 2025
- Tradingeconomics.com, March 18, 2025
- WSJ.com, March 20, 2025
- KPMG.com, March 25, 2025
- CNBC.com, March 12, 2025
- Reuters.com, March 26, 2025
- CNBC.com, February 11, 2025
- WSJ.com, March 19, 2025
- GardenPals.com, January 15, 2024
- GoodRX.com, 2025
- FA.gov, 2025
- GardenCenterMag.com, September 25, 2024
- TodaysHomeowner.com, April 21, 2024
- CDC.gov, 2025
- Cornell.edu, 2025